Most crypto traders struggle with timing. They chase pumps or sell during a panic, missing the real moves. Moving Average Convergence Divergence (MACD) helps you avoid this trap. It tracks market momentum, so you can stop trading on emotion and start trading on data.
This guide will show you how to use MACD in crypto to improve your timing and make smarter, faster decisions.
Table of Contents
What is the MACD Indicator?
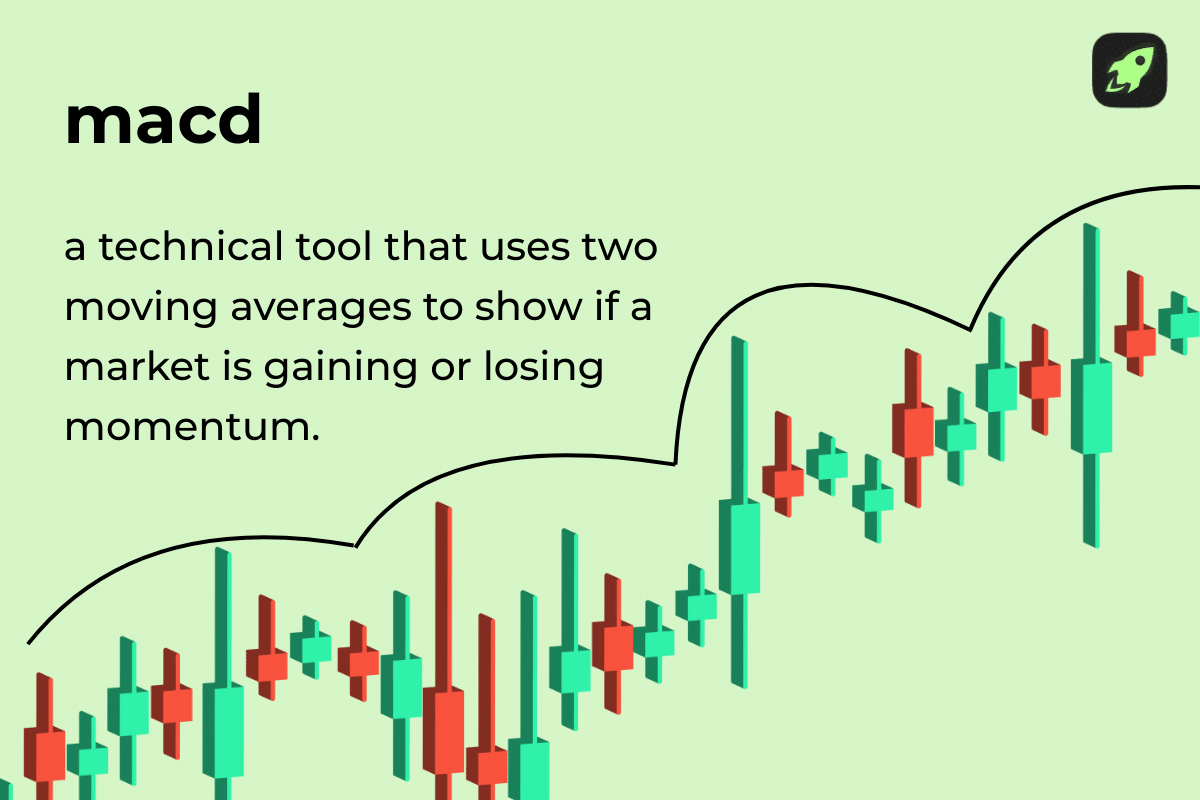
MACD—short for Moving Average Convergence Divergence—is a momentum indicator that combines two moving averages and a signal line to detect bullish or bearish momentum changes. It was invented by Gerald Appel in the 1970s and remains one of the most popular technical indicators in crypto trading today.
MACD consists of two lines and a histogram. The MACD line shows the difference between two exponential moving averages (EMAs): the 12-period and the 26-period. The signal line is a 9-period EMA of the MACD line itself. The histogram measures the gap between these lines. A wider gap means stronger momentum. A narrowing gap signals weakness.
Why MACD is Powerful for Crypto Traders (Volatility, Momentum, Trends)
When prices swing wildly, and trends change overnight, MACD helps you cut through the chaos by showing bullish or bearish momentum clearly. MACD focuses on sustained momentum.
MACD doesn’t predict moves like a leading indicator. Instead, as a lagging indicator, it confirms them based on price trends. That’s useful in crypto, where momentum often matters more than short-term predictions.
When Bitcoin or Ethereum gains upward momentum, the MACD line usually crosses above the signal line. If prices stall or drop, the lines converge. A crossover points to a possible reversal. Traders watch these shifts to time entries and exits. For example, a long run of downward momentum shows up clearly on MACD, even if prices bounce around intraday. This helps you stay patient and avoid panicking over small price blips.
In crypto’s 24/7 financial markets, you need tools that simplify trading decisions. MACD gives you that edge by visualizing momentum directly on the chart. It’s why many traders rely on it to ride trends instead of guessing them.
MACD Components
MACD has four parts: the MACD line, signal line, histogram, and zero line. Each shows a different view of momentum.
The MACD Line
This is the core of the indicator. It’s the difference between two exponential moving averages (EMAs)—the 12-period minus the 26-period. When the MACD line rises, the short-term average moves faster than the long-term one. That shows momentum is increasing. On most charts, the MACD line is the blue line.
The Signal Line
This is a 9-period EMA of the MACD line. It smooths out fluctuations and highlights turning points. When the MACD line crosses above the signal line, you get a bullish signal line crossover. That’s often a sign to buy. When it crosses below, you see a bearish crossover, which usually signals a potential sell.
The MACD Histogram
The histogram plots the gap between the MACD line and the signal line. Bars above zero show bullish momentum. Bars below zero show bearish momentum.
When the bars shrink, momentum weakens. Traders call this losing momentum. A shrinking histogram can warn of an upcoming trend reversal.
The Zero Line
The zero line is the middle ground. When MACD crosses it, the short-term and long-term EMAs are equal. A move above zero signals a bullish trend. A move below zero points to a bearish trend. Many traders wait for MACD to cross the zero line to confirm a trend’s direction.
Together, these tools help you track momentum shifts and plan better trades.
Core MACD Signals and How to Read Them
MACD sends out a few core trading signals. Learning these helps you time entries and exits with more confidence.
Signal Line Crossovers
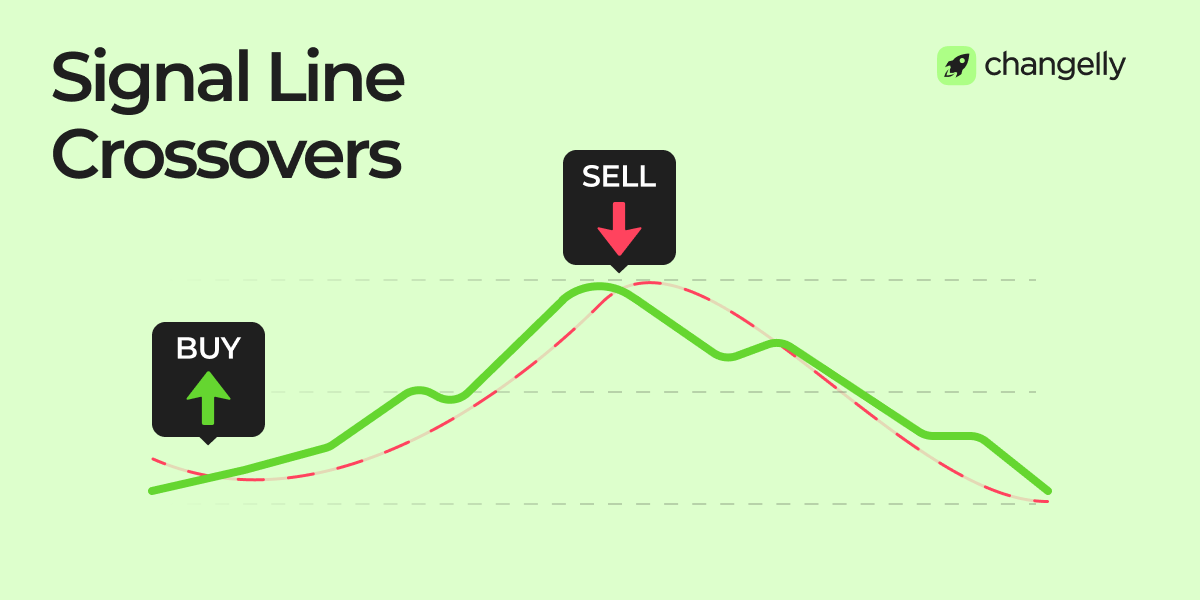
One of the most common MACD signals is the MACD line crossing the signal line. If the MACD line crosses above, you get a bullish crossover, a classic buy signal. If it crosses below, that’s a bearish crossover, usually seen as a sell signal. Many traders base buy or sell signals on these moves.
Zero Line Crossovers
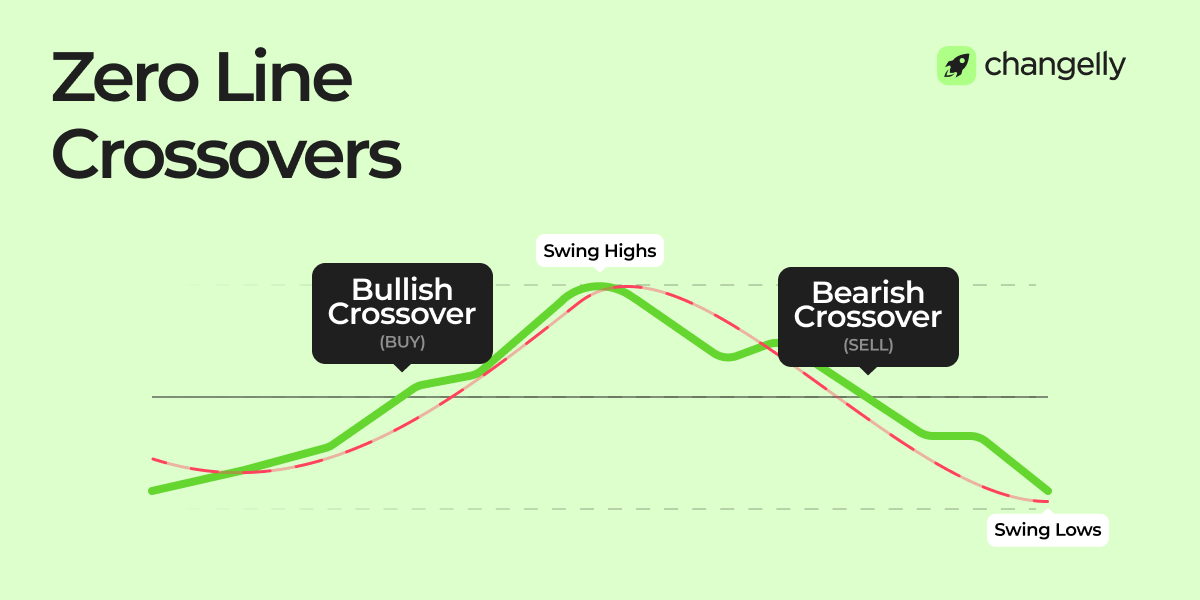
A zero line crossover happens when MACD moves from negative to positive, or vice versa. This shifts the overall momentum bias. When MACD crosses above zero, it confirms a bullish trend. When it crosses below, it suggests the market is turning bearish. These crossovers signal broader trend shifts, not just short-term momentum.
MACD Divergence
A divergence happens when price and MACD move in opposite directions.
- Bullish divergence: Price makes lower lows while MACD makes higher lows. This often warns that downward momentum is fading.
- Bearish divergence: Price makes higher highs while MACD peaks get lower. This suggests the uptrend is losing momentum.
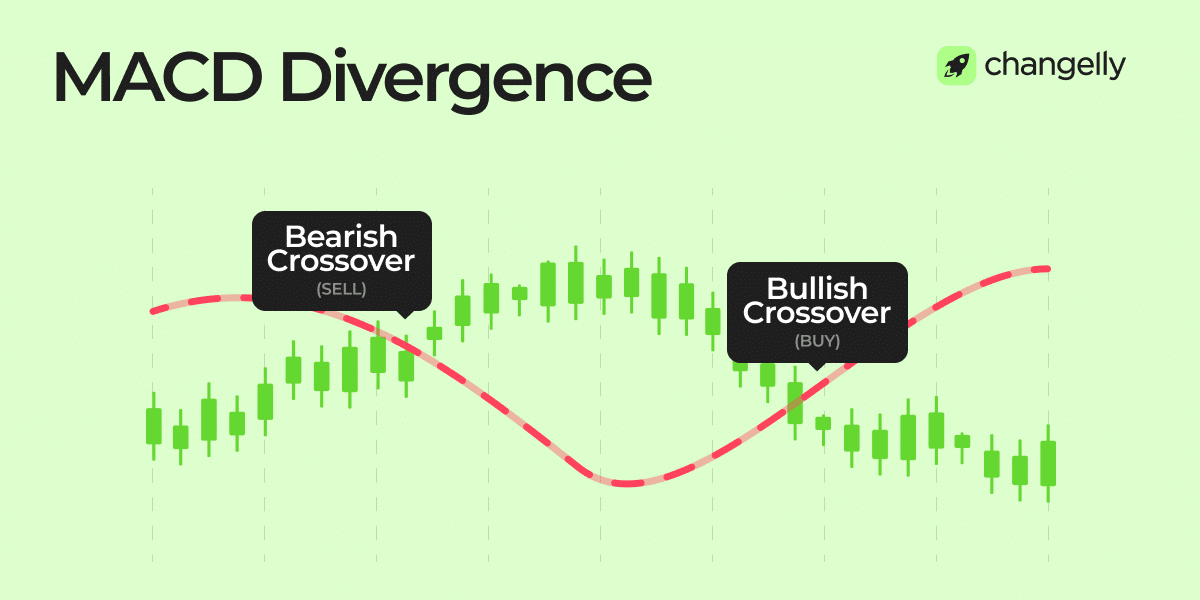
Traders watch for divergence to catch early signs of a possible reversal. But divergences aren’t perfect. They work better when confirmed by other signals.
Histogram Dynamics
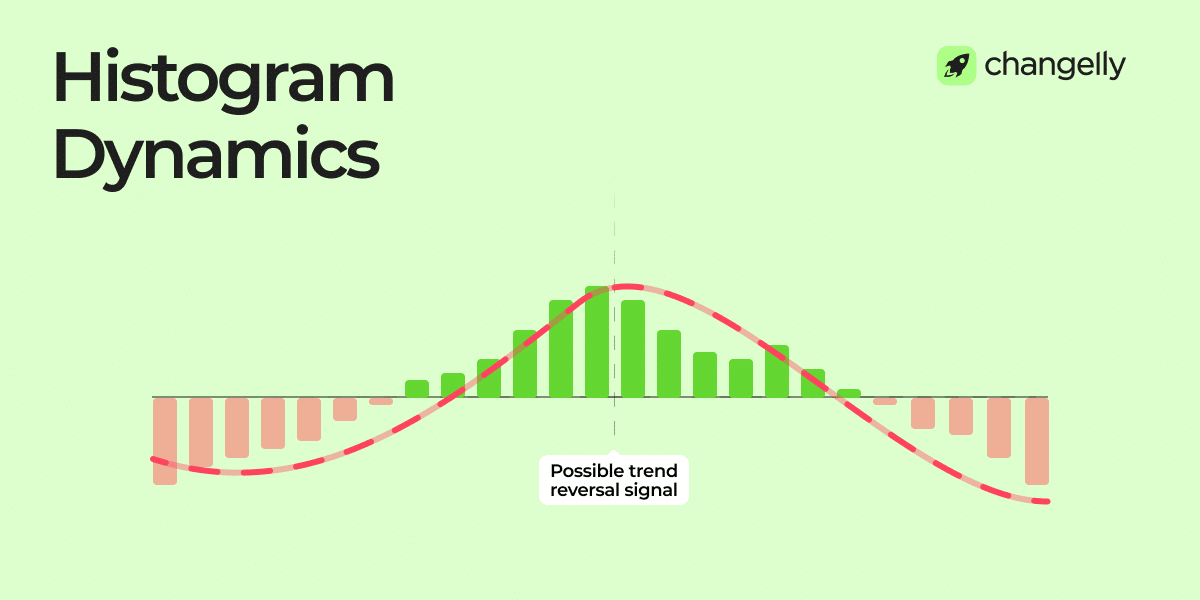
The MACD histogram tracks the distance between MACD and the signal line. Growing bars show strong momentum. Shrinking bars warn that momentum is slowing. If the bars shrink during a downtrend, bearish momentum might be weakening. If they shrink in an uptrend, bullish strength could be fading.
These tools help you spot trend shifts before they become obvious on price charts.
How to Apply MACD to Your Crypto Trading
MACD is a core tool in any crypto trading strategy. It works well on Bitcoin, Ethereum, and most altcoins.
Identifying Entry Points with MACD
A bullish crossover is a typical buy signal. When the MACD line moves above the signal line, momentum is shifting upward. Traders often buy here, especially if the crossover happens near support or after a correction. This MACD trading strategy helps you catch the start of a potential trend.
Spotting Exit Opportunities Using MACD
A bearish crossover happens when the MACD line crosses below the signal line. This warns of weakening momentum. Many traders take this as a sell signal or use it to set exit points, especially if price hits resistance or if other tools agree.
Adjusting MACD Settings for Different Timeframes
On most trading platforms, MACD settings are flexible. The standard is (12,26,9), which is two exponential moving averages and a 9-period EMA for the signal line.
For faster trades, try (6,13,5).
For long-term trends, use (24,52,18).
Combining MACD with Other Indicators
MACD works better alongside other technical indicators. Pair it with the Relative Strength Index (RSI) to confirm trades. For example, a buy signal is stronger if RSI is rising from oversold levels. You can also check volume, trend lines, and support zones to reduce false signals.
MACD shows clear entry and exit points, but it works best as part of a broader trading plan.

How to Get Free Crypto
Simple tricks to build a profitable portfolio at zero cost

Risk Management with Moving Average Convergence Divergence
You can see that Moving Average Convergence Divergence is a powerful tool. But it can’t predict every market move. That’s why you need strict risk management:
- Always control position sizing, most traders risk just 1–2% per trade.
- Use stop-loss orders to limit damage if the trade goes against you.
- For profit-taking, set clear targets or use a trailing stop.
- If Moving Average Convergence Divergence hints at momentum fading, be ready to adjust.
This approach protects you from sudden volatility, especially in crypto’s 24/7 markets. Risk management turns good setups into long-term trading success.
Limitations of MACD Use for Crypto
The MACD crypto strategy is useful, but it has limits, especially in volatile or sideways markets. Since MACD is a lagging indicator, signals often confirm trends after they’ve started, not before.
Another issue is that signal line crosses can produce false signals in choppy markets. During low-volume periods or price consolidations, you might get several crossovers that lead to whipsaws. That’s why many traders combine MACD with other indicators like RSI or volume. It’s also smart to look at longer timeframes for clearer signals. Remember: no indicator works perfectly in every condition. Use MACD as part of a broader trading system, not as your only tool.
Mistakes New Traders Often Make with MACD
New traders often misuse MACD because they treat it as a “magic signal”. One common mistake is relying on oversold conditions without context. MACD doesn’t tell you if a coin is truly oversold. It shows momentum, not valuation.
Another issue is using Moving Average Convergence Divergence signals alone, without checking market structure. For example, entering a trade just because MACD crosses without looking at support and resistance can lead to bad entries.
Many traders also forget to consider the timeframe. A signal on the 5-minute chart might contradict the daily chart, but unless you’re a day trader, it’s better to focus on longer timeframes for more reliable signals. Inconsistent timeframes lead to confusion and losses.
Finally, some traders ignore technical analysis basics. MACD is just one tool, and it works best when combined with volume, trend lines, and candlestick patterns. If you use MACD without a bigger strategy, you’ll likely fall into common traps and overtrade.
Final Words
The Moving Average Convergence Divergence indicator is one of the most trusted tools in crypto trading. It simplifies momentum tracking and helps you spot trend changes faster. But like any indicator, it’s not perfect. Use MACD as part of a complete trading strategy that includes risk management, other signals, and clear goals. Smart trading comes from combining tools, not relying on a single one.
FAQ
Is MACD bullish or bearish?
MACD can be both. A bullish MACD divergence suggests upward momentum may follow, especially if the price forms lower lows while MACD makes higher lows. A bearish signal happens when the MACD line crosses below the signal line, indicating downward pressure. Since MACD is a momentum oscillator, it tracks the strength of trends, not just direction. When divergence occurs, it often warns of a possible reversal.
Read also: Reversal Candlestick Chart Patterns
What is the best timeframe for using MACD in crypto trading?
You can use MACD alongside different timeframes, but the best one depends on your strategy. For swing trades, many cryptocurrency traders prefer daily or 4-hour charts. Day traders often use the 15-minute or 1-hour charts for quicker signals. A rule of thumb is to align MACD with your trading style. Use longer timeframes to follow trends and shorter ones for fine-tuning entries or exits.
Can MACD be used effectively for altcoins, or is it better for Bitcoin and Ethereum?
You can use MACD on both. For Bitcoin and Ethereum, MACD works well because of their high liquidity and clear trends. For altcoins, it’s still effective—but you need to identify divergence carefully. Low-cap or thinly traded coins can produce more false signals due to erratic price action. Always combine MACD with volume analysis and broader market context when trading altcoins.
What is the best MACD for BTC?
For Bitcoin, the default MACD (12,26,9) works well on daily charts. Some traders tweak it to (24,52,18) for long-term trends or (6,13,5) for faster signals on short-term charts. The best setting depends on your style—whether you’re swing trading or day trading BTC. Always backtest your MACD setup before using it live.
Should I change the default MACD settings (12-26-9) for crypto trading?
Yes, you can adjust MACD based on your strategy. The default (12,26,9) works for most cases, but faster buy and sell signals come from using (6,13,5). This is helpful for day traders or scalpers. For long-term investing, slower settings like (24,52,18) reduce noise. There’s no universal “best” setting, test different configurations on your favorite crypto assets to see what fits your goals.
Disclaimer: Please note that the contents of this article are not financial or investing advice. The information provided in this article is the author’s opinion only and should not be considered as offering trading or investing recommendations. We do not make any warranties about the completeness, reliability and accuracy of this information. The cryptocurrency market suffers from high volatility and occasional arbitrary movements. Any investor, trader, or regular crypto users should research multiple viewpoints and be familiar with all local regulations before committing to an investment.


