There are a number of different chart patterns that traders have to watch out for to optimize their trading strategies. The bear flag pattern is one of them.
The bear flag is one of the most reliable continuation patterns. Often seen in downtrends, it is formed when there is a sharp sell-off followed by a period of consolidation. The objective of trading this pattern is to catch the next leg down in the trend.
Hi, my name is Zifa. I’ve been deeply immersed in the world of crypto, writing and analyzing trends for over three years. In today’s discussion, we’ll delve into everything you need to know about the bear flag pattern — from its appearance on charts to effective trading strategies utilizing this pattern. Join me as we explore the intricacies of the bear flag and how it can be a game-changer in your trading approach.
Table of Contents
What Is a Bearish Flag Pattern? Bear Flag Meaning
A bear flag is a technical analysis charting pattern used to predict the continuation of a bearish trend. The pattern is composed of two parts: the flag and the flag pole. The flag pole is formed by a sharp sell-off that takes place at the beginning of the pattern, and the flag is created by the period of consolidation that follows.
What does a bearish flag indicate?
A bearish flag indicates that the price may continue to drop. It appears during a downtrend, showing a brief pause or slight upward movement before likely resuming the decline. Traders see it as a signal that the downward trend will likely continue once the pattern completes.
The Anatomy of a Flag Formation
Flag formations play a crucial role in technical analysis, aiding in the interpretation of stock price behavior. These patterns emerge when a significant price surge is succeeded by a consolidation phase, forming a recognizable flag-like shape on the chart. Understanding flag formations is key for traders to detect potential trend continuations or reversals.
Spotting a Downtrend
In technical analysis, identifying a downtrend involves examining specific indicators like moving averages, trendlines, and chart patterns. A downtrend is evident when the chart displays a sequence of lower peaks and troughs, signifying a shift from support to resistance levels. Tools like downward-trending moving averages and trendlines that link lower peaks provide confirmation of a downtrend. Chart patterns, such as head and shoulders or descending triangles, can also signal a downtrend. Traders often employ short-selling strategies in these scenarios to profit from the anticipated downward movement of prices.
Understanding the Flagpole
The flagpole is a key component of the flag formation, representing a rapid and steep price movement on a trading chart. This movement is often seen after a significant breakout. The flagpole’s main characteristics are its marked length and the strong momentum it demonstrates, which can vary depending on the chart’s timeframe. Traders use the flagpole to gauge potential trade entry and exit points, looking for a consolidation phase, referred to as the “flag,” that follows. This phase suggests a temporary pause in momentum, providing a setup for either a bullish or bearish continuation.
How to Identify a Bear Flag Pattern?
Trading the bear flag: how to implement flag related strategies?
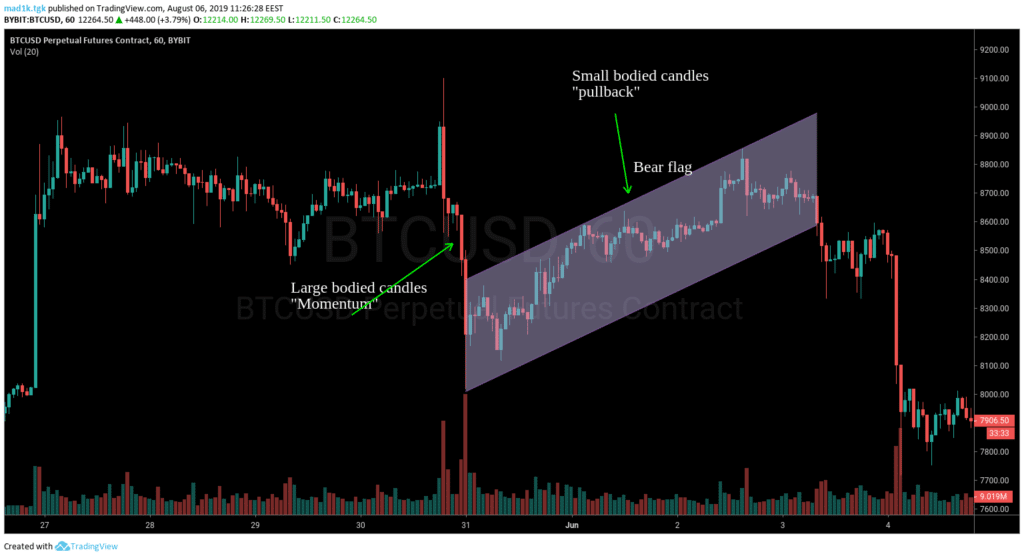
First things first, what does a bear flag look like? Well, take a look at the picture below — here’s a typical bearish flag pattern.

There are a few things you need to look for when trying to identify this pattern:
– First, you need to see a sharp sell-off in price. This sell-off should be accompanied by high volume. A notable increase in volume during the bearish flagpole formation signals strong selling pressure, indicative of a bearish trend. Conversely, during the flag’s upward consolidation phase, a decrease in volume typically occurs, suggesting a lack of bullish momentum and a possible weakening of the upward movement. As the bearish trend resumes with the flag pattern completion, an increase in trade volume often follows, affirming the bearish pressure. For traders, this growth has a great meaning because it supports decisions like initiating short positions or exiting long positions.
– After the sell-off, the price will enter a period of consolidation. This is typically marked by lower volume and tighter trading range.
– Once you have identified these two parts of the pattern, you can then look for a breakout to the downside from the consolidation phase. This is typically signaled by a move below support or a forming bearish candlestick pattern.
50-Period MA: Key to Bear Flag Detection
The 50-period Moving Average (MA) is important for distinguishing real bear flag patterns from false signals because it provides a reliable measure of the market’s intermediate trend, helping traders avoid misleading setups. Here’s why it’s a key tool:
- Trend Clarity: The 50-period MA gives traders a clearer view of the market’s overall direction by smoothing out short-term fluctuations. For a bear flag pattern, it’s crucial that the price stays below this MA, signaling a true downtrend. If prices move above it, the trend may be shifting, which could invalidate the bear flag and prevent traders from entering a position based on incorrect signals.
- Pattern Confirmation: A bear flag pattern relies on the premise that prices will continue downward after a brief consolidation. The 50-period MA acts as a checkpoint—if the price consistently stays below it during the flag phase, it supports the bearish trend, reinforcing the validity of the bear flag pattern.
- Dynamic Resistance: During the bear flag formation, the 50-period MA can act as a moving resistance level, where prices may briefly rise (within the flag) but struggle to break above the average. This resistance confirms that bearish sentiment is still strong, so it is more likely that the price will drop further rather than reverse upward.
- Reliable Breakout Signal: When the price breaks below the bear flag’s lower boundary while staying under the 50-period MA, this confirms that the downward trend is likely to continue. It gives traders additional confidence in the breakout, suggesting that the pattern is legitimate and not a false signal.
- Filtering Noise: The 50-period MA helps filter out temporary price movements that could mislead traders. Without it, traders might misinterpret minor upward movements in the flag phase as a potential reversal, causing premature or incorrect trades.
In essence, the 50-period MA helps validate the bear flag pattern and gives traders confidence that the setup they’re seeing aligns with the true market trend so they can make more informed trading decisions and avoid costly errors.
Bull Flag & Bear Flag Patterns

This bearish chart pattern also has a bullish counterpart — the bull flag pattern (also known as a downward flag pattern or bullish flag pattern). It has a similar structure but moves in the opposite direction: bull flags are a bullish continuation pattern, signaling a continuation of the rise in value instead.
Bear flag vs Bear pennant

The bear flag and the bear pennant are chart patterns used to identify bear markets. They both appear as downward-sloping trends that are followed by a brief period of consolidation before the price continues its decline. The main difference between these two patterns is that the bear flag is characterized by a sharp drop in price that is quickly followed by a period of consolidation, while the bear pennant has an extended period of sideways trading before continuing its downward trend. Both patterns indicate bearish activity and can be used to anticipate potential reversals and prepare for short positions.
Read also: Reversal candlestick patterns.
How to Trade Crypto With a Bear Flag Pattern
There are a number of different trading strategies that you can use when trading bear flag pattern. One popular strategy is to wait for a breakout from the consolidation phase and then enter a short position. Another option is to buy puts or sell call options when the price breaks below support.
Regardless of which strategy you stick to, it is important to keep in mind that this pattern is best used in downtrends. This means that you should look for bearish signals before entering any trade.
Remember to employ a combination of different technical indicators and market analysis techniques to confirm your trade signals before entering any positions. Also, always use risk management tools such as stop-loss orders to protect your capital.
Let’s explore some of the most popular bear flag trading strategies.
Wanna see more content like this? Subscribe to Changelly’s newsletter to get weekly crypto news round-ups, price predictions, and information on the latest trends directly in your inbox!
From Zero
to Crypto Hero
Learn crypto basics in 25 minutes with Pickle. Plus, grab a $100 bonus to start swapping smarter


Bear Flag Pattern Strategy
Trading with bear flags involves identifying this bearish pattern and applying strategic approaches to capitalize on potential downward movements. Here are three effective strategies:
Strategy №1: Bear Flag Breakout Downside
This strategy focuses on entering a trade during the breakout phase of a bear flag. Wait for the price to break below the flag’s lower boundary, which signals a continuation of the initial downtrend. This breakout is often accompanied by increased trading volume, which confirms the bearish momentum.
Let’s take a look at an example of how you might trade a bear flag pattern using this strategy.
Since bull and bear flag patterns represent that an asset is overbought or oversold, respectively, they’re often combined with various technical indicators, like the RSI.
- To identify a bearish flag pattern, we first need to recognize the flagpole — the initial sharp sell-off. At the same time, we have to keep an eye on the volume — it needs to be high — and the RSI, which should be below 30.
- Next, we have to wait for the breakout from the consolidation phase. That means that you should place your short order as the “flag” zone of this chart pattern ends.
- Most traders usually place their trades on the candle that goes directly after the one that confirms the break of the pattern. The pattern is usually considered broken when the price goes below the support level — the flag’s lower border.
- Place a stop loss at a level that is comfortable for you. Most traders usually set it at the resistance level of the flag — its upper border.

Strategy №2: The Bear Flag Pattern and Fibonacci Retracements
In this approach, use Fibonacci retracement levels to identify potential reversal points within the flag pattern. After the initial downward move (flag pole), apply Fibonacci levels to the rebound. Traders often look for retracement levels like 38.2%, 50%, or 61.8% as potential areas where the price might resume its downtrend. Enter a short position if the price reverses from one of these Fibonacci levels.
Strategy №3: The Bear Flag and Support Breakout
This strategy involves waiting for a price drop below a significant support level within the flag pattern. A bear flag forming near or at a key support level can strengthen the likelihood of a bearish continuation. Once the price breaks this support, it can trigger a sharper decline, offering a strategic entry point for a short position.
Entry Strategies
For entering trades, consider the following:
- In the breakout downside strategy, enter a trade when the price closes below the flag’s lower boundary.
- With Fibonacci retracements, enter when the price reverses from a key Fibonacci level.
- In the support breakout strategy, enter after the price decisively breaks below a significant support level within the flag.
Stop Loss Placement
Place stop losses to manage risk effectively:
- For breakout trades, set a stop loss just above the flag’s upper boundary.
- When using Fibonacci levels, place it above the most recent swing high within the flag pattern.
- In support breakout trades, set the stop loss just above the broken support level, now acting as resistance.
Profit Targets
Setting profit targets involves measuring the initial flagpole’s length and projecting it downward from the breakout point. This method ensures that your profit targets are in line with the pattern’s historical momentum and offers a realistic expectation of the price movement. For a more conservative approach, you can also set profit targets at key support levels below your entry point.
In summary, trading with bear flags requires a keen eye for pattern recognition and strategic execution. Whatever tools you are using — breakout signals, Fibonacci retracements, or support level strategies — entry points, stop loss placement, and profit targets are critical components for successful trading in bearish market conditions.
Is Bear Flag a Reliable Indicator?
A bear flag pattern is a reliable indicator for predicting the continuation of a bearish trend. However, it is crucial to remember that this pattern is best used in downtrends. This means that you should look for bearish signals before entering any trade. Also, be sure to place your stop loss above resistance so that you can protect your capital if the trade goes against you.
Additionally, bear flag patterns should always be confirmed using other indicators, like the RSI.
Pros and Cons of the Bear Flag Pattern
Pros:
– A bear flag pattern is a reliable indicator for predicting the continuation of a bearish trend.
– It is useful for making profitable short trades.
Cons:
– Just like any other indicator, the bear flag can be unreliable.
– Investors who’d rather avoid risky trades will have limited opportunities to make a huge profit when using this chart pattern.
Read also: Chart patterns cheat sheet.
What Is a Failed Bear Flag?
A failed bear flag occurs when a bear flag pattern, which typically signals a continuation of a downtrend, does not lead to a breakdown in price. Instead of continuing downward, the price reverses and breaks above the flag’s upper boundary, invalidating the bearish signal. This failure can often result in a bullish movement, as traders may interpret the reversal as a signal of buying pressure or trend reversal.
To identify this on a price chart, look for these key features:
- Stable Support Level: The price does not break below the flag’s lower support, a crucial element in confirming a bearish pattern. This stability suggests a potential shift in market sentiment.
- Moderate Volume Fluctuations: Unlike a typical bear flag where volume drops significantly, in a failed bear flag, volume decreases modestly. This indicates weaker bearish momentum, depressing the validity of the bearish pattern.
- Bullish Breakout: Contrary to bear flag expectations, the price breaks above the upper resistance line. This breakout on the price chart signals a bullish reversal that challenges the initial bearish assumption.
- Volume Increase on Retests: When previous price levels are retested with an increase in volume, it often points to a strengthening bullish trend, diverging from the expected bearish outcome.
In bear flag trading strategies, to recognize a failed bear flag is to mitigate potential losses — an utterly valuable skill. By identifying these signs on a price chart, traders can adapt their strategies to align with the new market direction, seizing opportunities or avoiding missteps in a shifting market.
Final Thoughts

The bear flag pattern is one of the most popular price action patterns. It is used to predict the continuation of a bearish trend. It is a powerful tool, but just like any other element of technical analysis, it should not be used in isolation.
Cryptocurrency prices are unpredictable, and traders should always be mindful of extreme volatility when analyzing crypto market trends. Be careful and conscious of the market situation, and don’t get caught up in FOMO. And, of course, don’t forget to DYOR!
Bearish Flag Chart Pattern: FAQ
What happens after a bear flag pattern?
After a bear flag, the price typically continues downward if it breaks below the flag’s lower boundary, suggesting a continuation of the downtrend.
Can a bear flag be bullish?
Yes, occasionally. If the price breaks above the flag instead of down, it can invalidate the pattern and indicate potential bullish movement.
Is the bear flag bullish?
No, the bear flag pattern is a bearish continuation pattern.
Is the bear flag bearish?
Yes, the bear flag pattern is a bearish continuation pattern.
What does a bear flag pattern mean?
A bear flag pattern is a chart pattern that suggests a temporary upward price movement during a downtrend, indicating the potential for the price to continue falling afterward. It looks like a small upward-sloping rectangle (the flag) following a sharp decline (the flagpole).
How do you trade a bear flag pattern?
The best way to trade a bear flag pattern is to look for bearish signals in downtrends. You can enter a short position when the price breaks below support or buy puts/sell calls when the price forms a bearish candlestick pattern.
What is an example of a bear flag chart pattern?
Examples of this price pattern can be seen in all financial markets. Here’s one from Foreign Exchange (Forex):

And here’s another example from the crypto sphere — formed on the BTC/USD candle chart.
How reliable are bear flags?
A bear flag pattern is a reliable indicator for predicting the continuation of a bearish trend. However, it is not absolutely accurate and can sometimes be misleading, so it should be used in combination with other trading indicators.
How long does a bear flag last?
Bear flag patterns can last for days or even weeks. However, it is worth noting that the longer the consolidation phase lasts, the less reliable the pattern becomes. Therefore, it is best to enter trades when the consolidation phase is relatively short.
What invalidates the bear flag?
The bear flag indicates that the current price trend may be coming to an end and the price target is reversing itself.
However, it does not guarantee trend reversal: the pattern can be easily invalidated by market conditions or other factors. For example, if the price fails to break the lowest point of the flag pattern or if prices move out of the bear range (outside of what would be expected for flag continuation), then this invalidates the pattern. Additionally, if there are volumes that are larger than normal, this could also invalidate the potential bear flag.
It is important not to rely on chart patterns alone when making trading decisions but to combine them with other technical indicators as well as fundamental analysis.
Disclaimer: Please note that the contents of this article are not financial or investing advice. The information provided in this article is the author’s opinion only and should not be considered as offering trading or investing recommendations. We do not make any warranties about the completeness, reliability and accuracy of this information. The cryptocurrency market suffers from high volatility and occasional arbitrary movements. Any investor, trader, or regular crypto users should research multiple viewpoints and be familiar with all local regulations before committing to an investment.