Doji candlesticks are considered one of the most important trading patterns. Learning how to see and use a Doji can help you improve your trading or investment strategy and increase your chances of making profitable trades. In this blog post, we’ll take a look at what Doji candlesticks are and how you can use them to make wise investment decisions. Stay tuned!
Table of Contents
What Does a Doji Candle Mean?
The name “Doji” comes from the Japanese word for “blunder,” which reflects that this formation typically occurs when traders make mistakes.
In technical analysis, a Doji is a type of candlestick pattern that can be used to predict future price movements. The Doji candlestick forms when the opening and closing price of the asset are roughly equal, resulting in a small body with long upper and lower shadows. This pattern can appear in any timeframe, but it is most commonly present on daily charts.
Want to learn more about crypto trading? Then don’t forget to subscribe to our weekly newsletter!
From Zero
to Crypto Hero
Learn crypto basics in 25 minutes with Pickle. Plus, grab a $100 bonus to start swapping smarter


How Is a Doji Candlestick Formed?
This pattern consists of two parts called “wick” and “body.” The wick is the vertical line; the body is the horizontal line. Since the top of the wick symbolizes the highest price and the bottom embodies the lowest, its length might fluctuate. The longer the wicks, the more intense the battle between bulls and bears. The body represents the difference between open and close price. This element’s width cannot be altered, but its height can.
When the market opens, bullish traders push prices up while bearish traders reject the higher price and drive it back down, forming a Doji. Bulls may also fight back and raise prices after bears attempt to bring them as low as possible. In other words, it is a sign of the market’s ambiguity.

What Does a Doji Tell Us?
While the Doji candlestick chart pattern alone is not enough to confirm a trend reversal, it can serve as part of a broader technical setup. For example, if the Doji forms after an extended downtrend, it could signal that bears are losing control and that a reversal to the upside is likely. Likewise, if the Doji forms after an extended uptrend, it could signal that bulls are running out of steam and that a reversal to the downside is possible. As such, traders should always be on the lookout for Doji patterns when analyzing price charts.
How Do You Read a Doji?
The Doji candlestick pattern relates to the candlestick method of technical analysis. Either a bullish or a bearish engulfing candlestick can create a Doji.
First of all, you should determine what type of Doji you see on the chart. Each type has its own special meaning, so this step is crucial. After that, you need to refer to the meaning of the pattern, determine preceding and possible subsequent price movements, as well as the sentiment of the market as a whole, and make trading decisions based on that.
It is important to note that a Doji per se is not a signal to buy or sell. Rather, it should be used in conjunction with other technical indicators to form a complete trading strategy. For example, a bullish Doji may occur at the end of a downtrend, thus indicating that prices are about to reverse and go higher. Similarly, a bearish Doji at the top of an uptrend could signal that prices are about to fall. Ultimately, by understanding how to read a Doji, traders can gain valuable insights into market sentiment and make more informed trading decisions.
Types of Doji Candlestick Patterns
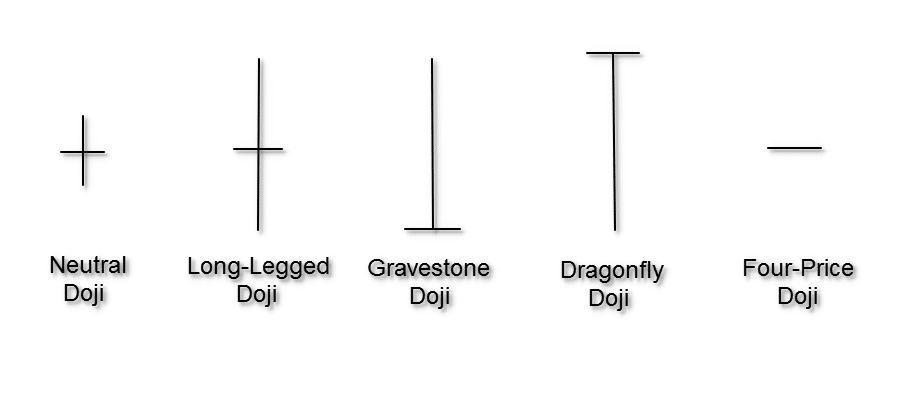
Neutral Doji/Doji star
There are several different types of Dojis, but the most common is a Neutral Doji, which has equal highs and lows. Neutral Dojis (also named common Dojis or rickshaw men) can occur at any time during an uptrend or a downtrend and may signal a change in direction, but they are not always reliable.
Long-Legged Doji Pattern
A Long-Legged Doji is a candlestick pattern that can help predict changes in the market. The pattern is formed when the opening and closing prices are the same, but the highs and lows differ. This creates a long upper shadow and a long lower shadow, giving the appearance of a cross. Long-Legged Doji patterns can emerge at the top or at the bottom of trends signaling a change in direction. For example, if the market had been trending downward and then the Long-Legged Doji pattern emerged, it may signify the start of an upward trend. As such, traders can use this pattern to make decisions about choosing the time when to buy or sell.
Gravestone Doji
A Gravestone Doji is a type of candlestick pattern that is considered a bearish signal. With the open and the close being at the top of the candlestick and the high being at the bottom, the pattern resembles a gravestone, hence the name. The pattern typically forms after an uptrend and signals that bears are gaining control over the market. When combined with other candlestick patterns, the Gravestone Doji can serve as a useful tool for investors who want to sell their holdings or enter short positions.
Dragonfly Doji Candlestick Pattern
The Dragonfly Doji is one of the most distinctive and easily recognizable candlestick chart patterns. As its name suggests, this pattern looks like a dragonfly, with a small body and wings stretched out on either side. The Dragonfly Doji forms when open and close prices are approximately equal, which is considered a bullish signal. The long upper shadow indicates there was significant buying pressure during the day, but bears were able to push prices lower before the close. The Dragonfly Doji is often found at the bottom of a downtrend, and its appearance can signal a potential trend reversal. Traders will look for confirmation of this reversal by watching price action in the days following the formation of the Dragonfly Doji.
4 Price Doji
The 4-price Doji is a rare and distinctive pattern, often seen in low-volume trading or on shorter timeframes. It looks like a minus sign, indicating that all four price indicators — the high, the low, the open, and the close — were at the same level within a particular time period.
In other words, the covered period saw no movement in the market at all. This particular Doji pattern is unreliable and should be disregarded: it only depicts a brief period of market uncertainty.
Doji Examples in Crypto Market
Doji candles occur daily in the financial markets. Here are some examples of the pattern.
Doji vs Spinning Top
In the world of candlestick charts, there are two very similar-looking formations known as the Doji and the Spinning Top. Both occur when the opening and closing prices are very close together, resulting in a small body with long upper and lower wicks.
The main difference between the two is that a Doji has its open and close prices at the same level, while a Spinning Top has a slightly higher open or lower close. While both of these formations can emerge in any time frame, they most often signal a price reversal in longer-term charts. That’s why traders looking to enter or exit a position can find them very useful.
Pros and Cons of Doji Candlestick Pattern
The appearance of a Doji can be interpreted as a sign that the market is ready to change direction, although it can also be simply a pause in an established trend. One advantage of using Doji patterns as part of your technical analysis is that they can appear in both bullish and bearish trends, providing you with potential reversal signals in both directions. However, it is worth noting that Doji patterns are not always reliable. One should use them in conjunction with other technical indicators before taking any action.
How to Trade with Doji
If you’re looking for an advanced trading tool, give Changelly PRO a chance! It offers a variety of instruments, live portfolio reviews, and an educational hub for traders of different experience levels. Click here to try it now!
Step 1
Spot a Doji on a price chart. Look closely to define which type of Doji it is — this step is very important.
Step 2
Look for other indicators that can confirm or deny the signal.
For example, if the Doji is followed by a long bullish candlestick, this could be a sign that prices are about to move higher. On the other hand, if the Doji is followed by a long bearish candlestick, this could signify that prices are about to move lower.
Step 3
Use a Doji in conjunction with other technical indicators, such as support and resistance levels, to make more informed trading decisions.
If you feel like that’s too much of a nerve for you — it’s ok! There’s always a golden option — HODL. And if you’re looking for a trustworthy crypto exchange, we got you too. Changelly offers the best exchange rates, low fees, and 24/7 client support.
FAQ
Is a Doji bullish or bearish?
There are four main types of Doji patterns: Common, Dragonfly, Gravestone, and Long-Legged Dojis. Each has a slightly different meaning for traders trying to identify market direction.
Generally speaking, a Common Doji formation indicates hesitation, meaning that neither bulls nor bears can gain control.
The Dragonfly Doji is typically seen as a bullish reversal pattern since buyers were able to overcome selling pressure and push prices higher.
The Gravestone Doji is generally seen as a bearish signal as sellers managed to hold control for most of the day, but buyers stepped in near the close.
The Long-Legged Doji is less informative on its own but can provide context when found in certain price patterns.
Doji patterns can be helpful for traders trying to identify market reversals or breakout opportunities but should not be used on their own. To confirm any potential signals from the Doji pattern, one should look at other technical indicators, such as volume, support/resistance levels, and trend lines.
What happens after a Doji candle?
The Doji pattern forms at the top or at the bottom of a trend, as well as during periods of consolidation. Although there are various types of Doji patterns, they all share one key trait — that is, indecision. Depending on the type, this pattern can signal a possible end of a current trend. Above, we have analyzed each type in detail.
Why is Doji important?
A Doji is an important pattern because it can provide valuable insights into market sentiment.
What do 3 Dojis in a row mean?
3 Dojis in a row, a.k.a. “tri-star,” might indicate a potential change in the direction of the current trend, no matter whether it is bullish or bearish.
What is a Doji breakout?
A breakout occurs when the price moves above or below the Doji’s high or low, respectively. This signals that one side has won the battle and that prices are likely to continue in that direction. Historically, bullish breakouts have been more reliable than bearish ones, so many traders use a Doji breakout as a buy signal.
Disclaimer: Please note that the contents of this article are not financial or investing advice. The information provided in this article is the author’s opinion only and should not be considered as offering trading or investing recommendations. We do not make any warranties about the completeness, reliability and accuracy of this information. The cryptocurrency market suffers from high volatility and occasional arbitrary movements. Any investor, trader, or regular crypto users should research multiple viewpoints and be familiar with all local regulations before committing to an investment.


