Bitcoin seems to stay trapped in the range between $7,000 and $8,000. After a fast spike to the price of $10,000 in autumn 2019, it nosedived and hasn’t recovered yet. What has happened to the cryptocurrency, and what to expect from it in the nearest future? Read our BTC price technical analysis.
Table of Contents
Technical analysis of BTC: the main indicators to watch
Let’s focus on the following parameters: MA150/200, the Cycles’ High Volatility Zone, and the LMACD.
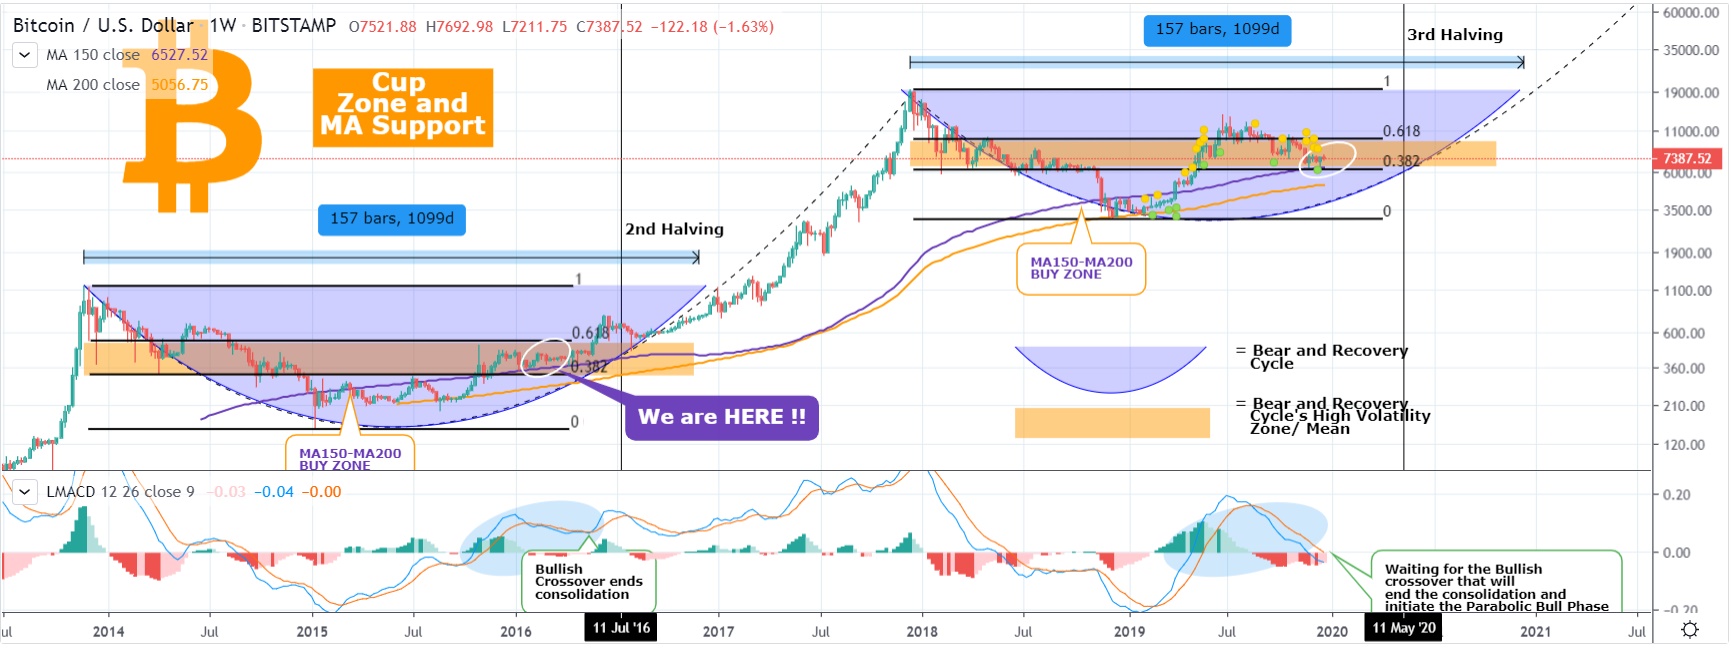
MA150/200 Buy Zone. On the 1-week chart, the zone between MA150 and MA200 has been at the bottom of every Cycle. This is a great opportunity to enter the market.
High Volatility Zone. While the MA150/200 zone provided the bottom, there is a certain zone that attracts the highest volatility during the bear cycle and the first year of recovery. You can see it in the orange area between the 0.382 and 0.618 Fibonacci retracement levels.
At the moment BTC is trading right above the 1W MA150 (blue trend line) after finding support (so far a double bottom) following the recent fall. The MA150 happens to be now on the 0.382 Fibonacci level. The price traded on the exact same level in February/March 2016.
We can suggest that Bitcoin is again consolidating within the High Volatility Zone after finding support on the MA150. The only difference with the previous Cycle is that this year, the price made a break out above the zone in June 2019, but was eventually corrected back into it.
LMACD. LMACD (Logarithmic Moving Average Convergence Divergence) is important during BTC technical analysis when we notice the next aggressive Bull run starting. Due to that break out above the High Volatility Zone in June 2019, the LMACD indicator never showed the consolidation it did on the previous Cycle and, just as it rose aggressively, it is on an equally strong decline at the moment. Traders are waiting for the bullish crossover on the LMACD which will essentially be the signal that the consolidation within the high volatility zone has ended and we are about to enter the parabolic bull phase to new all-time highs.
The role of halving
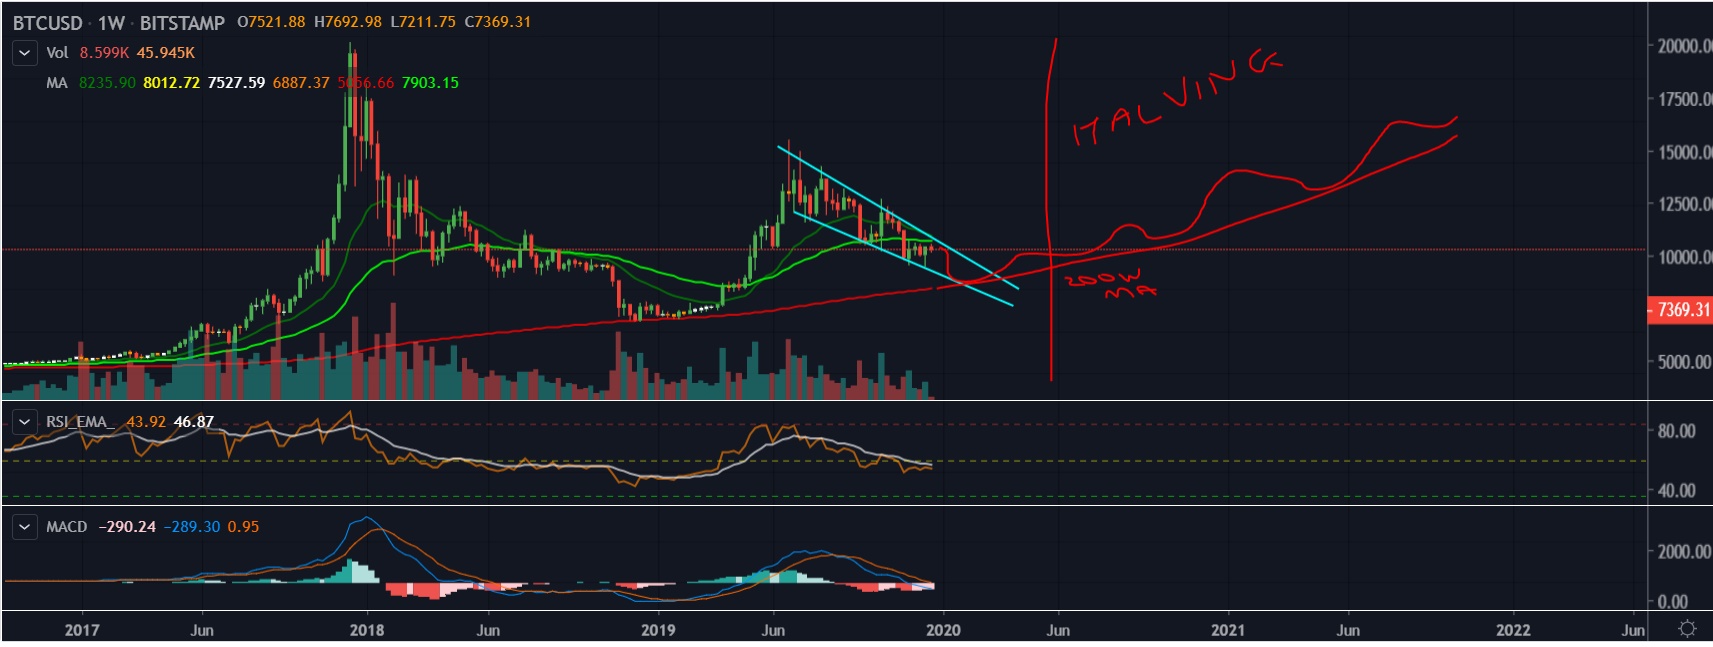
The upcoming halving in May 2019 plays a key role in this. In 2016, the consolidation ended right before July 2016 Halving (2nd). After a supply shock and subsequent decline, we entered the Parabolic Bull phase that lasted all the way to the $19,900 all-time high. The May 2020 Halving is not that far away and we may witness similar price action.
But before it happens, we may witness the last touch to the $6,775 price level before leaving the consolidation area. People could start buying BTC because of the 2020 May next halving as the main reason.
If we see one of the patterns (reversal patterns, price actions, candlestick formations) in that specific area ($6,500-7,000), we may consider buying BTC from there. The first targets would then be 9,000$ and $11,500.
Can BTC break out in 2019?
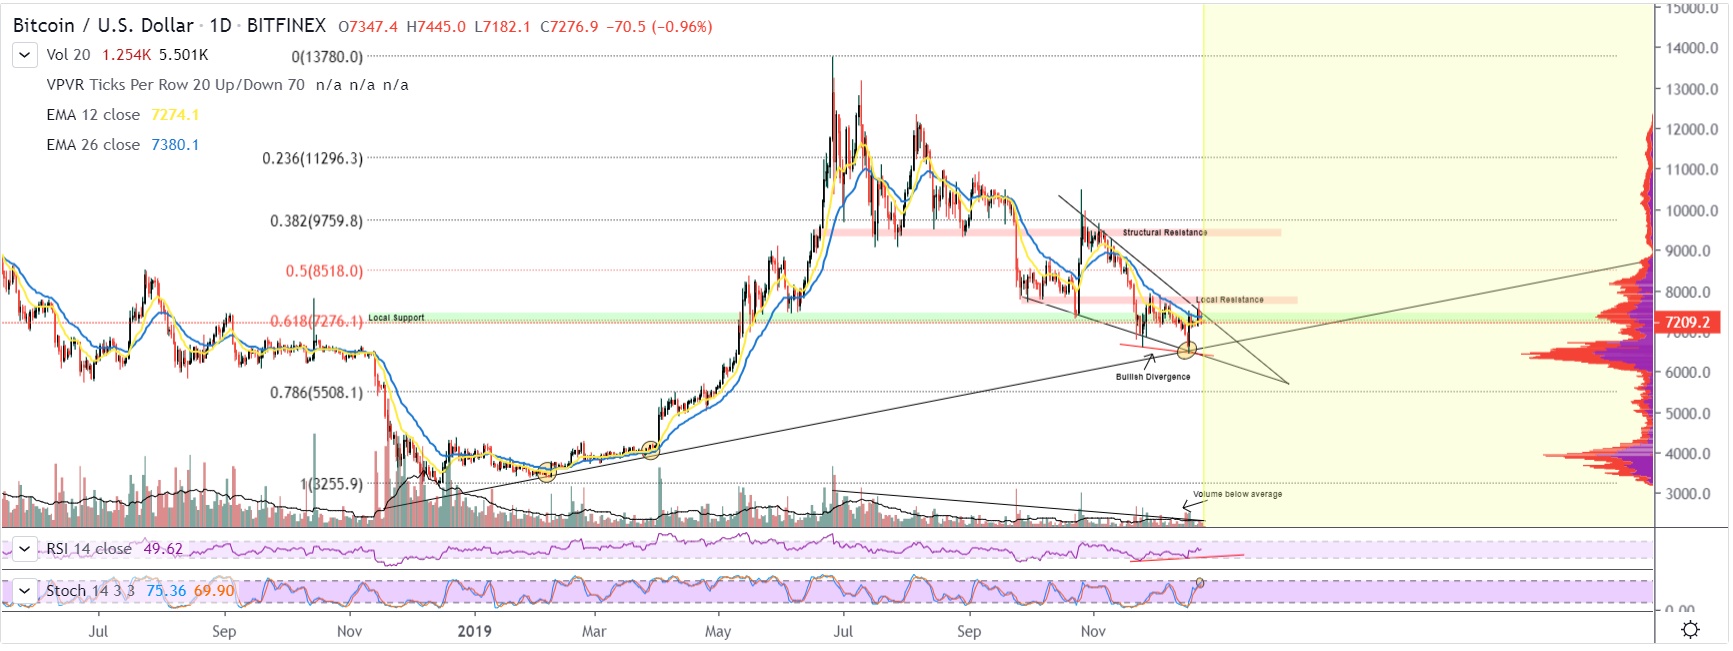
According to the Bitcoin technical analysis from the chart above, Bitcoin’s next move will depend on either break of support or a break of local resistance on the $7,800 level.
We should consider the following points:
- Trend is bearish
- Local resistance is found at $7,800
- Support at .618 Fibonacci
- Stochastic in upper regions
- RSI Diverging from price
- Volume stays below average
- EMA’s crossing
BTC/USD trend is currently in control by the bears because there are consecutive lower highs on the chart.
Local resistance is found at the $7,800 mark – a key level for the bulls to break in order to negate the overall market structure. Local support is in confluence with the .618 Fibonacci level: this is a must-hold price. The level should maintain for traders to expect a new higher low in the trend.
The stochastic is currently in the upper region and will stay there for an extended period of time through the momentum to the downside. The RSI has diverged from the price causing a bullish divergence. The volume is below average: an influx of volume is required to avoid a false break.
Bottom Line
Bitcoin’s technical analysis tells us that currently, we are at a critical point where a break in either direction will dictate the fate of the trend in 2020. A bearish break of a key Fibonacci level will increase the probabilities of further lower lows. A bullish break of local resistance ($7800) will negate the bearish structure and put in a new probable higher low.